Put analytics capability at everyone’s fingertips rather than a select few in your organisation. This powerful tool allows all the data connected to and generated by iStrives to be turned into visuals to identify trends and opportunities to improve decision making at all levels. Now you don’t need a separate business intelligence tool.
Combine data points and metrics to go beyond trends into analytics to make decision making easier
Export Intelligence
Each graph has an export function so that you can quickly access the raw data or simply reuse the visual for business updates and communications
Business Intelligence
Business Analysis
Combine data points and metrics to go beyond trends into analytics to make decision making easier
Export Intelligence
Each graph has an export function so that you can quickly access the raw data or simply reuse the visual for business updates and communications
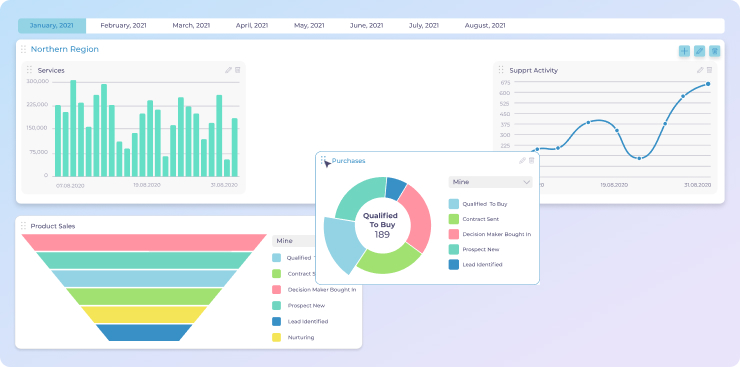
Dashboards
You are in complete control to create as many dashboards as you need so you can get a clear view of department, individuals, suppliers, and partner performance and outcomes. Make private dashboard as well as public dashboards, and don’t worry: your permissions settings control what each person sees
Trend Charts
Trend charts are available at all levels and help you quickly understand if your leading and lagging indicators are heading in the right direction. With iStrives, you can instantly interact with the trends to kick off any actions and/or send out positive messages to keep everyone motivated
Let's get the conversation started
Fill up the form and our team will get back to you within 24 business hours.
We use cookies to give you the best experience.
Cookie Policy
Let's get the conversation started
Fill up the form and our team will get back to you within 24 business hours.
Connect With us
Fill up the form and our team will get back to you within 24 business hours.
Let's get the conversation started
Fill up the form and our team will get back to you within 24 business hours.